When a chart has extraordinary big or small series or points in source data, the series/points may not be precise enough in the chart. In such cases, it can be handy to break the chart and make small or big series precise simultaneously.
CMD
<Cmd case="BaseExtensions:break-chart" applyThousands="xx"/>
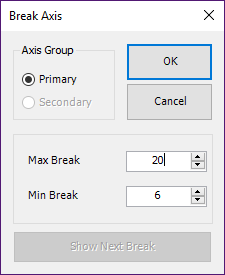
This feature is a tool that opens a dialog in which the user can define where the axis should break.
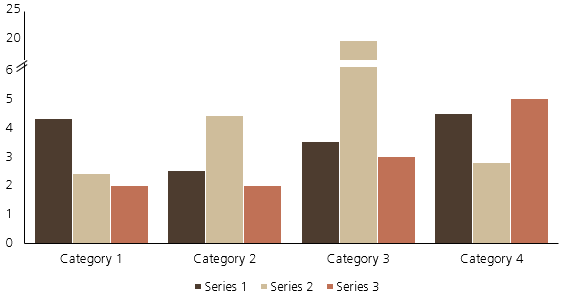
The chart below is an example, where the axis is broken between 6 and 20, and thus allowing the data points to be precise.
Parameters
applyThousands
Optional. Can either be true or false. If true, the command applies the thousand separators to both axes.
Was this article helpful?
That’s Great!
Thank you for your feedback
Sorry! We couldn't be helpful
Thank you for your feedback
Feedback sent
We appreciate your effort and will try to fix the article