If you ever find yourself in a position where you need to convey data in a way that allows your audience to better understand your conclusions or your intention, Corporate Charts & Tables are the tools for you.
You may have both tools enabled or just one of them depending on the setup chosen by your company.
It will take you no more than 10 min. to walk through the guide to learn how to operate Corporate Charts and Tables to make your data look on point and professional.
You will learn:
- How to create charts and tables in the correct brand colors
- Edit the text to fit your design
- Use the buttons to highlight important data
- Adjust cells by e.g. giving them another background color
- And much more

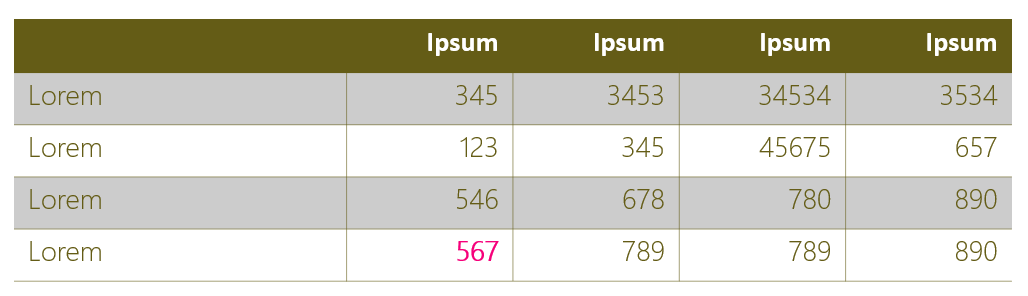
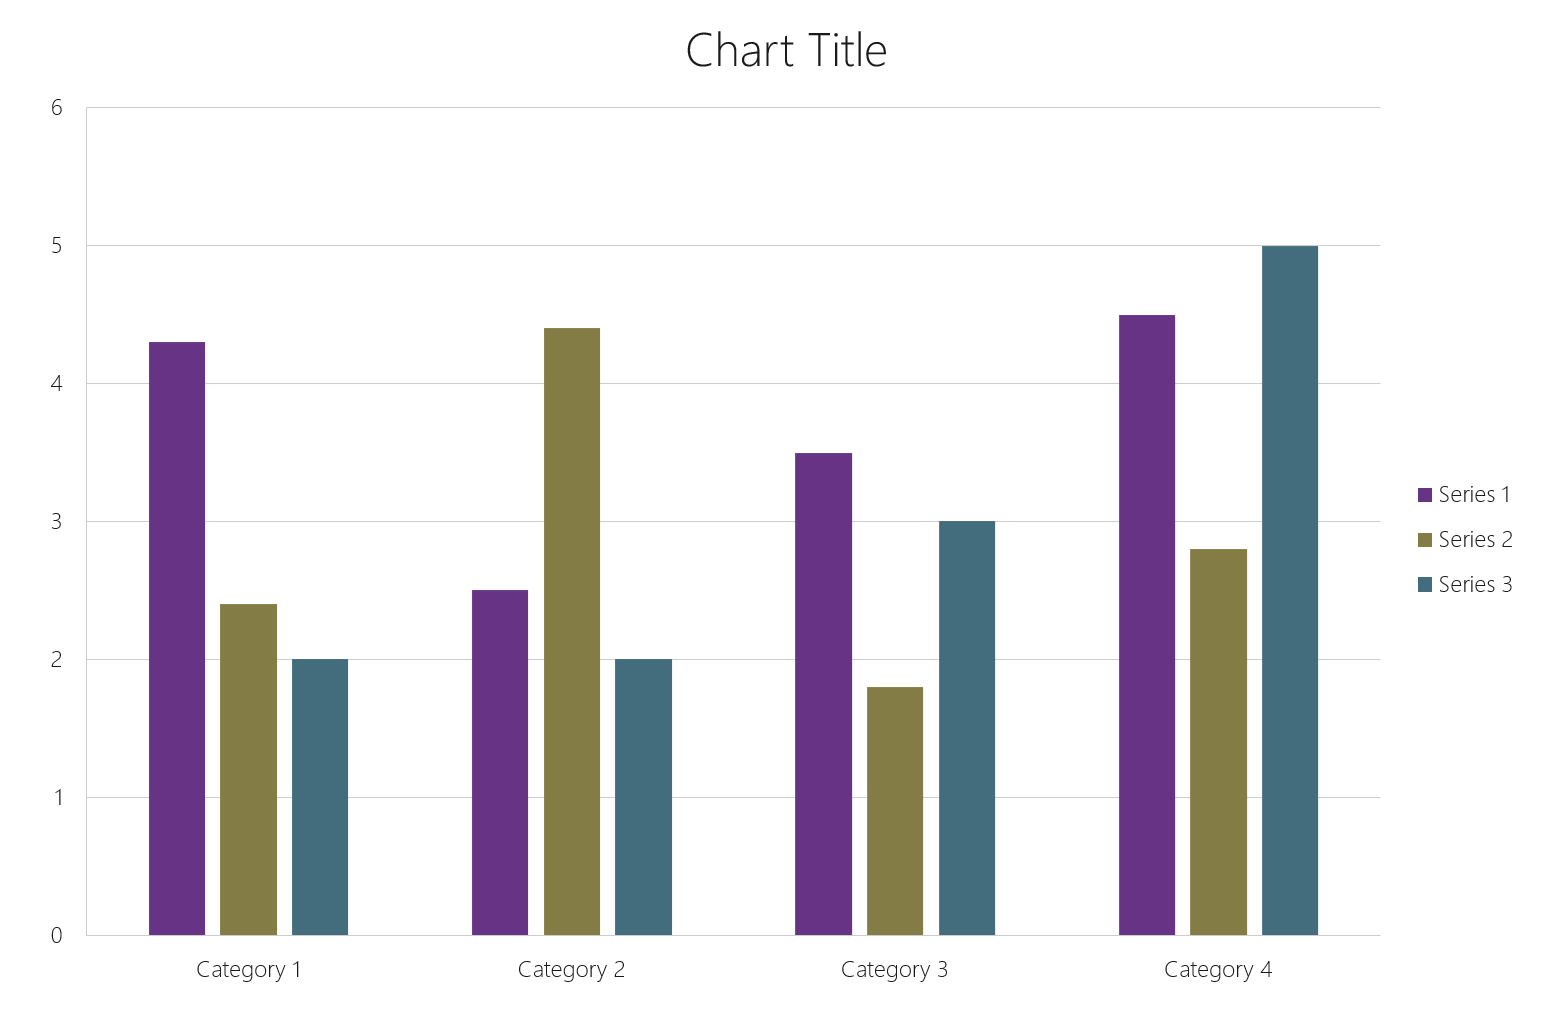
Screenshots of ribbon, table and chart
Download this guide to become the next expert within the charts and tables sphere.
Was this article helpful?
That’s Great!
Thank you for your feedback
Sorry! We couldn't be helpful
Thank you for your feedback
Feedback sent
We appreciate your effort and will try to fix the article